The operating performance of every mechanical component changes over the course of operation, with each component becoming defective at some point. It is crucial to recognize such a change before the component can no longer fulfill its function. This behavior can be illustrated very well by the so-called "bathtub curve". This indicates the probable failure rate over time.
每个机械部件的运行性能在运行过程中都会发生变化,每个部件都会在某个时刻出现缺陷。在部件不能再履行其功能之前,识别这种变化是至关重要的。这种行为可以用所谓的 "浴缸曲线 "来很好地说明。这表明随着时间的推移可能出现的故障率。
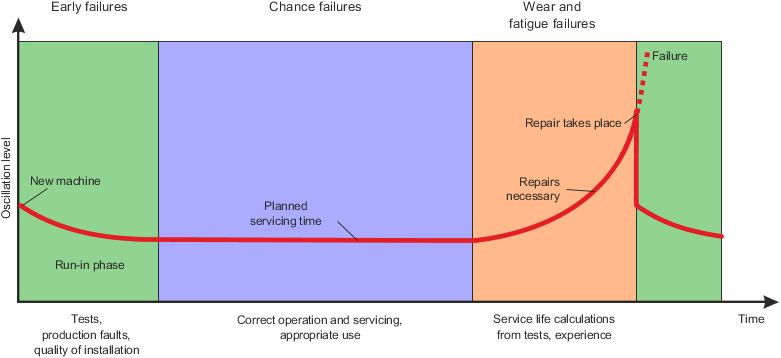
Fig.: Bathtub curve illustrating the 3 typical phases
图.: 图示 3 个典型阶段的浴缸曲线
Each component is subject to the regularities of this curve, with a typical trend emerging as a result.
•Area 1 (early failures) is characterized by a decreasing failure rate. Early failures are caused almost exclusively by errors in assembly or construction. However, special care and quality during production and commissioning significantly reduces the failure rate at the beginning. This area also explains the increased failure performance after an intervention in a system that functions well.
•During continuous operation in Area 2 (chance failures), the failure rate is almost consistent. These chance failures are fundamentally difficult to ascertain and, most importantly, not easily influenced. Operating and maintenance errors contribute towards an increase in the failure rate in this region.
•The failure rate increases dramatically in Area 3 (wear and failure due to fatigue). Wear and fatigue failures are primarily characterized by damage that progresses slowly over time.
The trend provides valuable information about the failure probability of the parameters measured by condition monitoring. This usually behaves like the bathtub curve, i.e. an increase in the characteristic value signifies a change in the system. The characteristic values can be synchronized with the operating parameters through the integration of automation technology. Assessing curve performance and incorporating operating parameters makes it possible to identify the best time to perform service work depending on condition.
In addition, oscillations are often representative of the condition of a machine or component. They are a good indication of wear or damage. One example of this is roller bearings. Surface damage (pitting) leads to increased oscillations in the bearing housing. These can be measured and evaluated. An increase in oscillations during operation indicates damage and/or increased wear. By constantly observing this condition, deviations from normal operation can be recognized immediately.
每个部件都受制于该曲线的规律性,因此出现了一个典型的趋势。
•区域 1 (早期故障) 的特点是故障率降低。早期故障几乎完全是由装配或施工错误引起的。然而,在生产和调试期间的特殊关注和质量保证大大降低了开始时的故障率。该领域还解释了在一个功能良好的系统中进行干预后,故障性能的提高。
•在 区域 2 (偶然故障)的连续运行期间,故障率几乎是一致的。这些偶然故障从根本上说是很难确定的,最重要的是,不容易被影响。操作和维护错误会导致该区域的故障率的增加
•区域 3 (磨损和疲劳导致的故障)的故障率急剧增加。磨损和疲劳故障的主要特点是随着时间的推移,损坏的程度会慢慢加深。
该趋势提供了关于状态监测所测量的参数的故障概率的宝贵信息。这通常表现得像浴缸的曲线,即特征值的增加标志着系统的变化,通过自动化技术的整合,特征值可以与运行参数同步。评估曲线性能并结合运行参数,就有可能根据条件确定进行执行维护工作的最佳时间。
此外,振动通常代表机器或部件的状况,它们是磨损或损坏的良好的指示。其中一个例子是滚子轴承。表面损坏(点蚀)会导致轴承座中的振动增加,这些可以用来测量和评估。运行过程中振动的增加表明损坏和/或磨损增加,通过不断观察这种情况,可以立即识别出与正常运行的偏差。