Oscillation signals generally consist of a number of oscillations that occur simultaneously and overlap. Individual frequencies are not directly evident from a timing diagram.
振荡信号通常由同时发生并重叠的多个振荡组成。从时域图上看,单个频率并不直接、明显。
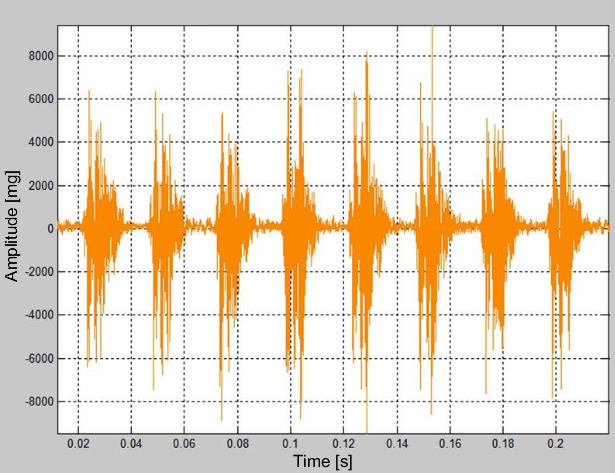
Fig.: Timing diagram of an oscillation
图: 振荡的时域图
Calculating a line spectrum is suitable for analyzing a mixture of oscillations of different frequencies where each participating oscillation and their frequencies and amplitudes are represented by a single line.
Within the scope of condition monitoring, spectra are a valuable aid in finding the cause of a failure. Many frequencies can be traced back to individual components so that damaged components can be identified.
计算线谱适用于分析不同频率的混合振荡,其中每个参与的振荡及其频率和振幅都由一条线表示。
在状态监测的范围内,频谱是寻找故障原因的一个有价值的帮助。许多频率可以追溯到单个部件上,以便识别损坏的部件。